Four teams of interns pitched their work product to state agency and tech sector mentors this week on the sidelines of Full Con Tech - the innovative problem-solving unconference in Seattle.
These students have worked through the summer with mentorship from companies like Microsoft, Socrata, Tableau and LiveStories to understand, clean up and visualize data from state agencies like Employment Security, Labor and Industries, Revenue and Early Learning. And the visualizations were EXCELLENT.
The students got top-knotch coaching on how to pitch product Seattle-style and we're slated to show the final product to Gov. Inslee on 10/28 at Results Washington's "Results Review"
Here are the current working copies of the students' work - kudos to all on the great product and pitches.
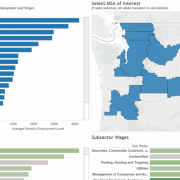
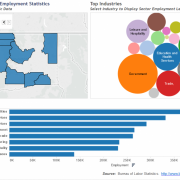
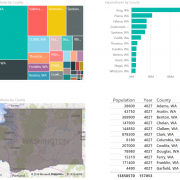
Andrew Weller's Tableau profile has the ESD Team's visualizations of employment by county
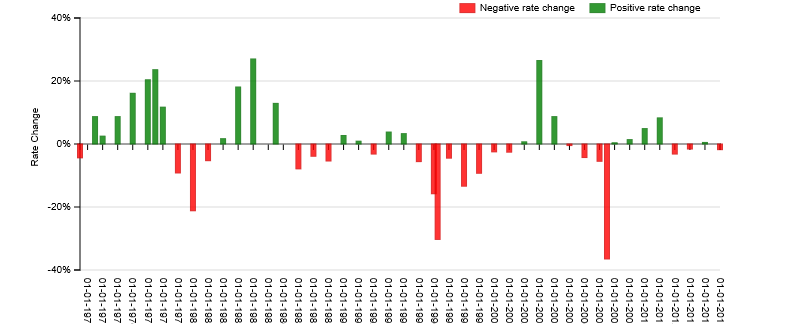
Granger Moch's demo site has the LNI workers compensation data, done in R with rSocrata
Pam Carlson's LiveStories page has the DOR cannabis data
Created with Highcharts 4.1.4MonthGross Income2,012,6002,012,6002,012,6003,466,6003,466,6003,466,6004,973,9004,973,9004,973,9007,397,5007,397,5007,397,50010,097,00010,097,00010,097,00013,485,00013,485,00013,485,00014,671,00014,671,00014,671,00016,981,00016,981,00016,981,00021,968,00021,968,00021,968,00025,508,00025,508,00025,508,00031,266,00031,266,00031,266,000JulyAugustSeptemberOctoberNovemberDecemberJanuaryFebruaryMarchAprilMay0M5M10M15M20M25M30M35MMaysum of Gross Income: 31,266,000
{"x":{"options":{"chart":[],"xAxis":{"type":"addTimeAxis","inputFormat":"%m-%d-%Y","tickFormat":"%m-%d-%Y"},"yAxis":{"type":"addMeasureAxis","order":"Effective.Date","title":"Rate Change","outputFormat":"%.2f","ticks":5},"zAxis":[],"colorAxis":[],"defaultColors":["red","green"],"layers":[],"legend":{"x":"20%","y":"1%","width":"70%","height":"60%","horizontalAlign":"top"},"y":"Percent.Rate.Change","type":"bar","groups":["CompositeNetRatePer100ofPayroll","RateChange"],"x":"Effective.Date","bounds":{"x":"10%","y":"5%","width":"80%","height":"70%"}},"data":{"Effective.Date":["01-01-2015","01-01-2014","01-01-2013","01-01-2012","01-01-2011","01-01-2010","01-01-2009","01-01-2008","07-01-2007","01-01-2007","01-01-2006","01-01-2005","01-01-2004","01-01-2003","01-01-2002","01-01-2001","01-01-2000","01-01-1999","01-01-1998","01-01-1997","04-01-1996","01-01-1996","01-01-1995","01-01-1994","01-01-1993","01-01-1992","01-01-1991","01-01-1990","01-01-1989","01-01-1988","01-01-1987","07-01-1985","01-01-1984","01-01-1983","01-01-1982","01-01-1981","01-01-1980","01-01-1979","01-01-1978","07-01-1977","01-01-1977","01-01-1976","01-01-1975","01-01-1974","07-01-1973","07-01-1972"],"Percent.Rate.Change":[-0.018,0.005,-0.016,-0.032,0.083,0.049,0.014,0.004,-0.365,-0.055,-0.043,-0.005,0.087,0.265,0.007,-0.026,-0.025,-0.093,-0.134,-0.045,-0.303,-0.158,-0.056,0.033,0.038,-0.032,0.009,0.027,-0.054,-0.039,-0.079,0.129,0.27,0.181,0.017,-0.053,-0.212,-0.092,0.117,0.236,0.204,0.161,0.087,0.025,0.087,-0.044],"CompositeNetRatePer100ofPayroll":["$2.18","$2.22","$2.21","$2.24","$2.32","$2.14","$2.04","$2.01","$1.27","$2.00","$2.12","$2.21","$2.23","$2.05","$1.62","$1.61","$1.65","$1.69","$1.87","$2.16","$1.58","$2.26","$2.68","$2.84","$2.75","$2.65","$2.74","$2.71","$2.64","$2.79","$2.91","$3.16","$2.80","$2.20","$1.86","$1.83","$1.94","$2.46","$2.71","$2.42","$1.96","$1.63","$1.40","$1.29","$1.26","$1.16"],"Accident.Rate":[0.3479,0.3482,0.3482,0.3482,0.3414,0.263,0.2517,0.2472,0.2588,0.2588,0.2724,0.2443,0.2372,0.2125,0.1795,0.1795,0.1941,0.2013,0.2126,0.2029,0.1481,0.2029,0.2029,0.196,0.1833,0.1746,0.1671,0.1619,0.1459,0.1341,0.1344,0.1349,0.1014,0.0835,0.0835,0.0815,0.0813,0.099,0.099,0.0841,0.066,0.0481,0.0384,0.0334,0.0296,0.0296],"RateChange":["Negative rate change","Positive rate change","Negative rate change","Negative rate change","Positive rate change","Positive rate change","Positive rate change","Positive rate change","Negative rate change","Negative rate change","Negative rate change","Negative rate change","Positive rate change","Positive rate change","Positive rate change","Negative rate change","Negative rate change","Negative rate change","Negative rate change","Negative rate change","Negative rate change","Negative rate change","Negative rate change","Positive rate change","Positive rate change","Negative rate change","Positive rate change","Positive rate change","Negative rate change","Negative rate change","Negative rate change","Positive rate change","Positive rate change","Positive rate change","Positive rate change","Negative rate change","Negative rate change","Negative rate change","Positive rate change","Positive rate change","Positive rate change","Positive rate change","Positive rate change","Positive rate change","Positive rate change","Negative rate change"]}},"evals":[]}{"viewer":{"width":800,"height":400,"padding":15,"fill":false},"browser":{"width":800,"height":400,"padding":40,"fill":false}}
DEL is reviewing the PowerBI viz of child care support options and spending by county.
ECY is treating the Bellingham Bay StoryMap as a proof of concept. It's on the Ecology geospatial servers pending review.